in either the time or frequency domains. We identified a distinctive frequency domain profile for the protein, as well as residues that might be of interest to the drug design and vaccine development communities due to their potential association with drug pocket formation and allostery.
Following previous work involving a 200-nanosecond molecular dynamics simulation of the S protein (PDB: 6VSB) at physiological conditions,1 the findings of this study were as follows:
1. Both phi and psi dihedral angles are dominated by a few discrete relatively low frequencies in the 23-63 MHz range, with 42.969MHz being the most prevalent frequency sampled by the oscillations.
2. The protein avoids similar population counts of frequencies that are relatively adjacent to each other, resulting in an alternating high-low-high profile of the tallied frequencies along the frequency spectrum.
3. Amino acids in relatively low abundance in the protein never oscillate at certain frequencies, in contrast to relatively abundant amino acids which cover the whole spectrum, suggesting that the frequency components sampled by the dihedral angles may be a function of position in the primary structure (ie, the more positions an amino acid is found in, the more frequencies it can sample).
4. Residues with high psi standard deviations correlate positively with residues that have high motility in Euclidean space.
5. Specific residues identified in the literature as constituting the inside of a druggable pocket, as well as other residues identified as allosteric sites, are observed in our data to have distinctive time domain profiles.
This last observation motivated us to propose other residues from our dynamic data with similar time-domain profiles that could possibly be associated with other pocket formation or allostery phenomena.
Frequency tally
Since there were no external forces applied to the protein at any time during the simulation that could introduce steady state changes to the vibrational frequencies, our approach involved carrying out a fast Fourier transform of each residue’s angle versus time data for both phi and psi to obtain frequency domain data for each residue. The covered spectrum thus spanned from 0MHz to just under 500MHz, the Nyquist or folding frequency established by our data collection frequency
Next, we tallied each observed frequency, processing each dihedral angle separately. Literature data was then consulted to see if any residues recognised as being important to allostery or drug binding demonstrated any defining features in our own data. Lastly, the frequency domain data was processed at the amino acid level for each chain (ie, looking at all lysine (LYS) in chain A, all LYS in chain B, etc) to see if there were any particular frequencies that uniquely persisted for each of the 20 amino acids (there were none). We note that the trimeric structure used in this study had one chain (A) in the “up” position (amenable for binding to host ACE2) and the other two (B and C) in the down position. Data processing was facilitated with the Java programming language and SQL MariaDB.

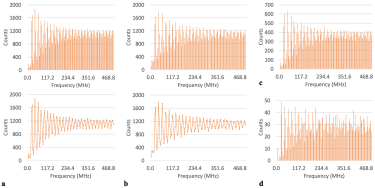
Figure 1: Tallied frequencies for all residues across all three chains for: a) the phi dihedral angles showing bar chart in top panel and line plot in bottom panel (for ease in seeing profile), b) the psi dihedral angle showing bar chart in top panel and line plot in bottom panel (for ease in seeing profile), c) tallied phi frequencies for all residues in the A chain and d) tallied phi frequencies for all threonines in the A chain (as an example of tally profile at the amino acid level).
As shown in Figure 1, the most prevalent frequency component sampled by all residues in the entire protein for both dihedral angles was 42.969MHz, with the frequency tally profile assuming the aforementioned high-low-high profile. Of note, the greatest difference in frequency population counts between relatively vicinal frequency values was found at the lower end of the spectrum, with this difference becoming less pronounced as the frequency increased.
Figure 1 also shows how this similar profile of the frequency tally was also observed for all residues in just a single chain, as well as for just one amino acid (ie, all threonine (THR)) also in a single chain.
Amino acids
Amino acids histidine (HIS), methionine (MET) and tryptophan (TRP) were of relatively low abundance- where each totalled between nine and 15 residues per chain from a total of over 1,000 residues per chain
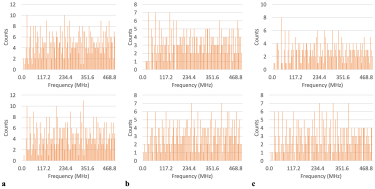
As observed in Figure 2, there were certain frequencies at which the dihedral angles of each amino acid failed to oscillate. Consequently, these unaccessed frequencies appear as gaps in the plotted tallies.
Figure 2: Frequency tallies showing un-accessed frequencies for: a) all histidines in the A chain, phi and psi in the top and bottom panels respectively, b) all methionines in the B chain, phi and psi in the top and bottom panels respectively, c) all tryptophans in the C chain, phi and psi in the top and bottom panels respectively.
Consolidating this analysis for all chains, interestingly revealed that histidine’s populations of frequency counts covered the whole spectrum for both phi and psi. Methionine and tryptophan, conversely, still had unaccessed gaps at the lowest frequencies for the whole protein concerning the phi dihedral angle, yet covered the entire spectrum with psi.
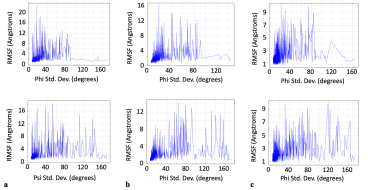
For each individual chain, plotting all the residues’ root mean square fluctuations (RMSFs) as a function of the standard deviations of their psi dihedral angles revealed a larger quantity of residues with relatively large RMSF values corresponding to the larger values of the psi standard deviations (over 90°) compared to phi (Figure 3).
This contrasted with the results observed for the phi standard deviations, which showed fewer residues at these higher values of the phi standard deviations and those residues that were present had relatively lower RMSF values (Figure 3).
Figure 3: RMS vs. dihedral angle standard deviation for: a) chain A, phi and psi in the top and bottom panel respectively, b) chain B, phi and psi in the top and bottom panel respectively and c) chain C, phi and psi in the top and bottom panel respectively.
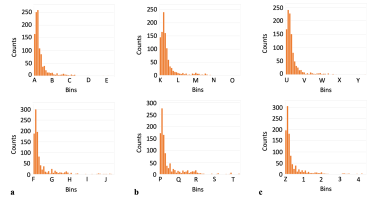
Key: A(4.9-8.2); B(41.1-44.4); C(77.4-80.6); D(113.6-116.9); E(149.8-153.1); F(4.6-7.9); G(40.9-44.2); H(77.2-80.5); 1(113.5-116.8); J(149.8-153.1); K(5.0-7.7); L(35.5-38.3); M(66.0-68.8); N(96.5-99.3); O(127.0-129.8); P(4.8-8.2); Q(41.3-44.6); R(77.7-81.0); S(114.1-117.4); T(150.5-153.8); U(5.1-8.3); V(40.0-43.2); W(74.9-78.1); X(109.8-113.0); Y(144.7-147.9); Z(4.8-8.2); 1(41.9-45.3); 2(79.0-82.3); 3(116.0-119.4); 4(153.1-156.5).
Figure 4: Dihedral angle standard deviation distributions showing positive skew profile for: a) chain A, phi and psi in the top and bottom panel respectively, b) chain B, phi and psi in the top and bottom panel respectively and c) chain C, phi and psi in the top and bottom panel respectively. All histogram distributions done with 50 bins.
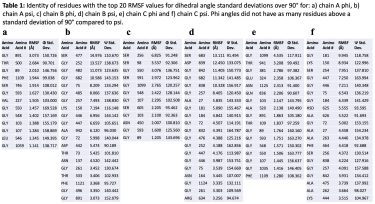
The identity of the residues in both cases for standard deviations greater than 90° is shown in Table 1, specifically for those residues with the top twenty RMSF values (a full set of 20 amino acids at this upper range of standard deviations was consistently absent for phi.
Histogram inspection of the distribution of the values of the standard deviations for all residues, for both phi and psi, also revealed that both dihedral angles had a positive skew profile in their values (Figure 4). Looking at each amino acid throughout each individual chain (ie, all LYS in chain A, then chains B and C separately) revealed that no frequencies persisted throughout the simulation for a given amino acid.
Several groups have previously identified residues important to either drug binding, allosteric effects or both, for the S protein. According to work by Alvarado et al. LYS369 and PHE377 appeared to have important allosteric properties since binding of luteolin to these residues in the S protein induced an intense allosteric effect.2
Verkhivker et al. reported that GLU406, ASN439, LYS417 and ASN501 were centres of allosteric interactions implicated in mediating long-range communications in the binding of the S protein with ACE2.3 Of these residues, LYS417 and ASN501, along with the additional residue of GLU484, were further identified to be important interacting centres that provide mutants at these positions with better binding affinity to ACE2.
Xue et al. additionally identified PHE329 and PHE515 as residues critical to centripetal motions of the RBD domain upon binding with ACE2.4 Drew and Janes also identified a druggable pocket and thus reported the amino acids lining this pocket.5
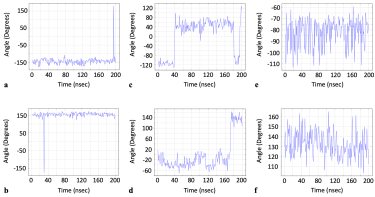
Our own data showed that the dihedral angle versus time profiles (phi, psi or sometimes both) for these very residues had a distinctive profile that consisted of either a dihedral angle rapidly assuming a value far from the baseline, then immediately returning back to baseline, or else the baseline would change very suddenly (Figure 5).
Figure 5: Dihedral angle values vs. time for residues identified in literature as either important to allostery or the formation of a druggable pocket: a) PHE 377 chain C phi [2], b) PHE 329 chain B psi [4], c) ASP 198 chain C psi [5], d) ASN 439 chain A psi [3]. Dihedral angle values vs. time for most other residues: e) PRO 39 chain A phi, f) ILE 332 chain B psi.
However, we note a complete absence of any distinctive frequency domain profiles for these residues. These unique time domain profiles contrasted to those observed for most other residues whose dihedral angle values instead oscillated within a single fixed bandwidth of dihedral angle values (Figure 5).
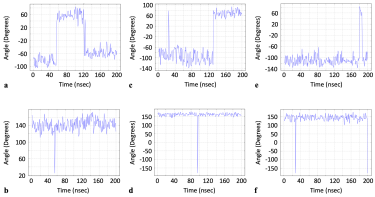
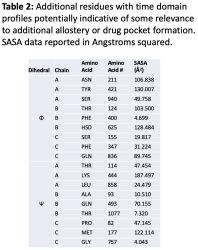
Consequently, we present a list of some other residues that were identified in our dynamic data as having similar profiles, for further investigation as potential residues of interest to the drug design community (Figure 6 and Table 2). Solvent accessible surface area (SASA) data for each residue is also provided to give preliminary insight into each residue’s potential accessibility to a drug-like compound.
Figure 6: Dihedral angle vs. time data for additional residues from our data set with time domain profiles similar to those residues previously identified as relevant to allostery and drug pocket formation: a) ASN 211 chain A phi, b) LEU 858 chain A psi, c) THR 124 chain B phi, d) THR 1077 chain B psi, e) PHI 347 chain C phi, f) PRO 82 chain C psi.
Given the potential correlation between the time domain profiles of the above residues with drug pocket formation and allostery, we suggest that these residues also be explored as specific targets for specially engineered vaccines. Such an approach could possibly incur the desired immune response per the property of the vaccine and also assist the body in fighting infection by sabotaging the S protein’s mechanics, which is a requisite for cellular infection.
Research on the use of antibodies as therapeutic molecules has precedent6 and this approach could yield a new generation of vaccines for COVID-19 with both therapeutic and immunological properties.
We also note that due to the insights our work has afforded on the properties of the S protein, we are presently looking to extend this approach to any protein by using deep learning to provide the time-dependent dihedral angle data needed for the time-domain and frequency-domain analyses.
Since our present work relied on computationally intensive molecular dynamics simulations, a trained deep learning model would provide data faster and without the need for supercomputing infrastructure. We are thus currently implementing this deep learning approach using Deep Netts deep learning technology to directly integrate with our existing Java platform. Our present data forms the basis of this approach as training data.
Dr Oscar Bastidas
Bastidas is a researcher in drug discovery and drug design focusing on the development of biologics-based therapeutics. His research interests specifically focus on using both experimental and computational methods such as big data analytics and artificial intelligence to develop peptide and small molecule therapeutics for viral diseases. He is currently working as a consultant in the pharmaceutical industry.
Dr Zoran Sevarac
Sevarac is a professor at the Department of Software Engineering at the University of Belgrade and researcher at the Laboratory for Artificial Intelligence at the same department. His research interests include neural networks, software engineering, Java and educational technologies. He is a founder of Neuroph and Deep Netts technologies and contributes to Apache NetBeans. He co‑leads visual recognition API JSR381 at Java Community Process, is a Duke’s Choice award winner and member of the prestigious Java Champions group.
References:
1. Peters MH, et al. Static all-atom energetic mappings of the SARS-Cov-2 spike protein and dynamic stability analysis of “Up” versus “Down” protomer states. PLoS One 15.11. 2020: e0241168.
2. Alvarado W, et al. Molecular characterization of COVID-19 therapeutics: luteolin as an allosteric modulator of the spike protein of SARS-CoV-2. Molecular Systems Design & Engineering 7.1. 2022: 58-66.
3. Verkhivker GM, et al. Comparative perturbation-based modeling of the SARS-CoV-2 spike protein binding with host receptor and neutralizing antibodies: Structurally adaptable allosteric communication hotspots define spike sites targeted by global circulating mutations. Biochemistry 60.19. 2021: 1459-1484.
4. Xue Q, et al. Computational Insights into the Allosteric Effect and Dynamic Structural Features of the SARS‐COV‐2 Spike Protein. Chemistry–A European Journal 28.6. 2022: e202104215.
5. Drew E D, Janes RW. Identification of a druggable binding pocket in the spike protein reveals a key site for existing drugs potentially capable of combating Covid-19 infectivity. BMC molecular and cell biology 21.1 2020: 1-13.
6. de la Lastra JM, Baca-González V, González-Acosta S, et al. Antibodies targeting enzyme inhibition as potential tools for research and drug development. Biomolecular Concepts. 2021 Jan 1;12(1):215-32.