Scientific workflow for hypothesis testing in drug discovery: Part 1 of 3
Posted: 6 December 2024 | Dr Raminderpal Singh (HitchhikersAI), Nina Truter | No comments yet
Explore the step-by-step scientific workflow behind drug discovery, from formulating hypotheses to analysing data, ensuring accurate and reliable results.


In drug discovery and biological research, the scientist’s workflow often follows a structured and iterative approach to ensure accuracy, reproducibility and scientific integrity. This article outlines the various stages of such a workflow, from hypothesis generation to data cleaning and interpretation, referencing the project workflow diagram (Figure 1).
At the heart of any research is the scientific question. This question shapes the direction of the entire investigation and helps to focus the analysis on specific hypotheses. Following this, it is important to generate hypotheses based on prior research and available datasets. These datasets, which may be either public or proprietary, provide the foundation for all subsequent analysis. Public datasets, while larger, often require careful scrutiny as they may contain noise or inconsistencies that need to be accounted for before beginning analysis.
On the other hand, proprietary datasets tend to be smaller and are generated under more controlled conditions, such as those derived from in-house assays or experiments conducted within a lab. These proprietary datasets typically do not require as much validation as public data but still necessitate a solid understanding of their experimental design and data generation methods.
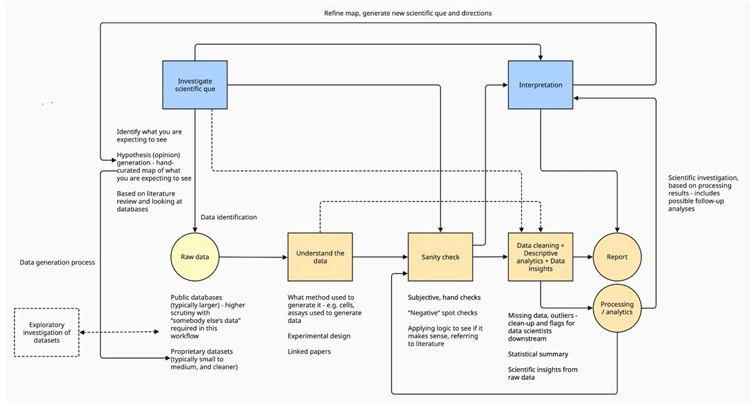

Figure 1: High-level workflow for early drug discovery
Once the raw data has been gathered, the next step is to gain a thorough understanding of the data. This includes verifying the experimental design and understanding how the data was generated –whether it was from RNA sequencing, mass spectrometry, or other biological assays. Public datasets, linked papers or supplementary documents often provide essential context about the experimental setup. These linked materials may describe the cell lines used, the specific conditions under which experiments were performed, and any potential limitations of the data. Without this information, the interpretation of the dataset may be speculative or lead to inaccurate conclusions.
The next critical step is the “sanity check” phase, where the integrity of the dataset is assessed. This process involves checking for biological inconsistencies or errors in the data, such as the presence of genes that should not be expressed in certain tissues. For example, while working on diabetes research, one can include proteins involved in bone metabolism in the dataset to ensure that they were not mistakenly expressed in the diabetic samples. If such gene expressions appeared, it would indicate that something was wrong with the data, necessitating further investigation before proceeding with analysis.
Additionally, sanity checks also involve the inclusion of negative controls, where researchers deliberately include genes or proteins that are not expected to be relevant to the condition being studied. This acts as a safeguard against false positives and misinterpretation of the data. By comparing the dataset to known biological patterns, researchers can detect potential anomalies and address them before proceeding to the next step.
After the sanity checks are completed, the data moves into the data cleaning phase. In this stage, missing data points, outliers, and other anomalies are handled. In vivo datasets, which involve experiments conducted on living organisms, often exhibit natural biological variation. For example, there may be outliers in control groups due to this variation. In such cases, removing outliers might distort the biological reality, so they are often retained in smaller datasets to preserve the integrity of the biological variability.
However, in larger datasets, such as those generated through RNA sequencing or mass spectrometry, true outliers can often be identified and removed without negatively impacting the analysis. It is crucial during this phase to strike a balance between removing erroneous data and preserving meaningful biological variability. In cases where control or treatment groups show large variability, this could reflect true biological responses to a treatment, and removing such data could reduce the accuracy of the analysis.
Once the data has been cleaned, it is then subjected to descriptive analytics. This stage involves generating statistical summaries that reveal patterns, trends, or anomalies in the data. Through methods such as statistical tests, plots, and data visualisation, researchers can begin to interpret the data and form insights. This phase often helps confirm whether the data aligns with the original hypothesis or if new patterns have emerged that warrant further investigation.
The final step is the generation of a report. This document summarises the data analysis process, including the key findings, statistical analyses, and interpretations. Reports are often shared with collaborators or stakeholders and serve as a record of the investigation. Importantly, the report can also raise new scientific questions, leading to further iterations of the workflow. This iterative nature of scientific investigation often leads to new discoveries as researchers refine their understanding of the data.
About the authors
Dr Raminderpal Singh
Dr Raminderpal Singh is a recognised visionary in the implementation of AI across technology and science-focused industries. He has over 30 years of global experience leading and advising teams, helping early to mid-stage companies achieve breakthroughs through the effective use of computational modelling.
Raminderpal is currently the Global Head of AI and GenAI Practice at 20/15 Visioneers. He also founded and leads the HitchhikersAI.org open-source community. He is also a co-founder of Incubate Bio – a techbio providing a service to life sciences companies who are looking to accelerate their research and lower their wet lab costs through in silico modelling.
Raminderpal has extensive experience building businesses in both Europe and the US. As a business executive at IBM Research in New York, Dr Singh led the go-to-market for IBM Watson Genomics Analytics. He was also Vice President and Head of the Microbiome Division at Eagle Genomics Ltd, in Cambridge. Raminderpal earned his PhD in semiconductor modelling in 1997. He has published several papers and two books and has twelve issued patents. In 2003, he was selected by EE Times as one of the top 13 most influential people in the semiconductor industry.
For more: http://raminderpalsingh.com; http://20visioneers15.com; http://hitchhikersAI.org; http://incubate.bio
Nina Truter
Nina Truter is a translational scientist with a deep focus on understanding mechanisms of action in drug development and leveraging disparate datasets in biotech. Based in South Africa, she has worked extensively with international biotech companies, specialising in therapeutic development for aging-related diseases and complex conditions such as glioblastoma and Autosomal Dominant Polycystic Kidney Disease (ADPKD).
Her recent work includes consulting for UK-based biotech firms and leading initiatives in HitchhikersAI.org to advance the translation of AI and data science into practical biotech solutions such as identifying combination therapy opportunities and enhancing patient selection. In her work, she uses a systems approach to integrate insights from diverse datasets across in vitro, in vivo, and human models, to answer critical scientific questions, and translate biological mechanisms into models that are used by advanced analytical methods such as Pearlian causal inference.
For more: https://njtruter.wixsite.com/ninatruter
Related topics
Analysis, Bioinformatics, Computational techniques, Drug Discovery, Drug Discovery Processes, Drug Targets, Genomics
Related people
Dr Raminderpal Singh, Nina Truter
